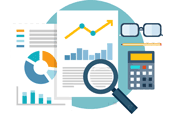
Data analysis is the process of evaluating data using analytical and statistical tools to discover useful information and aid in business decision making. There are a several data analysis methods including data mining, text analytics, business intelligence and data visualization. It is not as simple as it may seem. Information is absolutely useless unless you learn to extract the specific patterns of business processes and customer's behavior.
Our applications help your businesses to push the envelope of traditional business intelligence. We can help you all the way from data collection or acquiring data via API, wrangling, creating reports, visualizations and analyzing results.
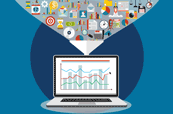
Relevant data must be collected from the appropriate sources, cleaned and formatted so that it becomes usable to data analysis tools (wrangled). QR Inventory, QR Mobile Data and other AHG applications already collect data we can use for the data analytics. Moreover, AHG applications already provide basic data analysis.
If you are not using one of our apps, we can connect to required source using API, use your database or devise a custom method and collect necessary data. Wherever and whenever data exist, we will find a way to get it into analyzable form.
Often, relevant data exists in different forms, in different sources, inside and outside your business. This might be a case, for example, when you want to analyse whether stock market movements (weather, oil prices, etc.) affect your sales (raw material prices, employee absenteeism, etc.) We wil design and implement a correct approach for working with disparate data sources.
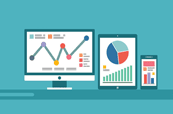
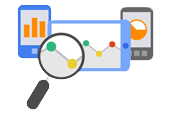
Data reporting -- creating custom reports and dashboards -- is an important first step of a system that reports key elements relating to an organization's performance in order to improve different aspects. Data reporting measures performance, analyzes other key elements that can then be shared within the organization or with the public.
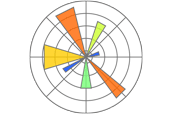
Our eyes easily discern colors and patterns. From art and ads to TV and movies, our culture is mainly visual. Data visualization is another form of visual art that grabs our interest and keeps our eyes on the message. When we see a chart, we quickly see trends and outliers, not the case if you stared at a massive spreadsheet of data. If we can see something, we internalize it quickly. Data Visualisation is storytelling with a purpose.
From Descriptive analytics (what happened) to Diagnostic analytics (why things happened) to Predictive analytics (what will happen), and to Prescriptive analytics (what should be done), including machine learning strategies to find patterns in large datasets, we help you make data-driven decisions in the face of uncertainty. Data analytics provides the insights that your businesses needs to make effective and efficient decisions.


Python is a highly functional programming language that is tailor-made for carrying out data manipulation and repetitive tasks, making it a valuable part of the data analyst's toolbox. Anyone who has worked with large amounts of data knows just how often repetition enters into it. By having a tool that handles the grunt work, the data analysts are free to handle the more interesting and rewarding parts of the job.
Python is simple enough for things to happen quickly and powerful enough to allow the implementation of the most complex ideas. It started with a good selection of libraries and over time has acquired many others that envelope fast algorythms implemented in C, such as matrix manipulations. A wide variety of Python libraries are available today. These libraries, such as Numpy, Pandas, Matplotlib, Scikit-learn and Bokeh help the data analyst carry out his or her functions without the need to "re-invent bicycle."